Explore
Featured
Recent
Articles
Topics
Login
Upload
Featured
Recent
Articles
Topics
Login
Upload
Search Results for 'frequency line'
frequency line published presentations and documents on DocSlides.
Frequency Tables and Line Plots
by trish-goza
Essential Question. :. How . can information be g...
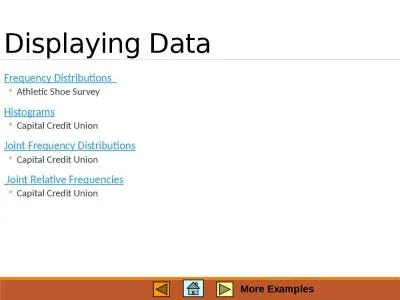
Displaying Data Frequency
by quinn
Distributions. . . Athletic Shoe Survey. Histogr...
Wavelength, Frequency, and Energy Practice Problems
by aaron
1. . A certain violet light has a wavelength of 4...
Time frequency visualization of surrounding
by kittie-lecroy
the line noise band for gravitational wave observ...
Frequency Analysis
by debby-jeon
Reading: Applied Hydrology Sections 12-2 to 12-6....
MICROWAVE FREQUENCY TRANSITIONS REQUIRING LASER ABLATED URA
by olivia-moreira
B. E. Long and S. A. Cooke. Funded by the Departm...
How do I create and interpret
by calandra-battersby
frequency tables . and . line plots. ?. Vocabular...
LINE POSITIONS OF CENTRIFUGAL DISTORSION
by conchita-marotz
INDUCED ROTATIONAL TRANSITIONS . OF METHANE . MEA...
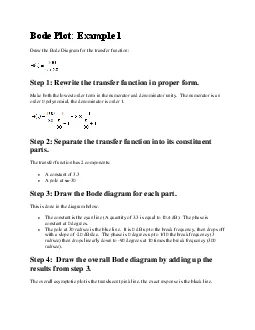
Bode Plot Example 1
by samantha
Draw the Bode Diagram for the transfer functionSte...
Frequency Analysis Reading: Applied Hydrology Sections 12-2 to 12-6
by molly
2. Frequency analysis for extreme events . If you ...
Line-shapes and intensities of carbon monoxide transitions in the (3
by yoshiko-marsland
0) band. . Z. Reed. ,. *. . O. . Polyansky. ,...
Ch 3: Transmission Line Parameters
by luanne-stotts
http://www.acs.psu.edu/drussell/Demos/superpositi...
Progress in CIGRE Working Groups on Lightning and Grounding
by karlyn-bohler
(and IEEE Task Force on HVDC Line Design). Member...
Biomedical Control
by danika-pritchard
Systems (BCS). Module Leader: Dr Muhammad . Arif....
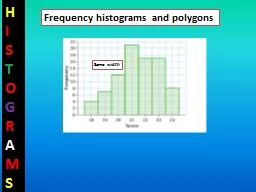
H I S
by debby-jeon
T. O. G. R. A. M. S. Frequency h. istograms and p...
Cross-Correlation in Gravitational Wave Data Analysis
by natalia-silvester
Clive Tomlinson. . Einstein’s General Theory O...
Uncovering Clusters in Crowded Parallel Coordinates Visuali
by debby-jeon
Alimir. . Olivettr. . Artero. , Maria Cristina ...
Feeders and Antennas
by alexa-scheidler
. A. Outer plastic sheath. B. Woven copper shiel...
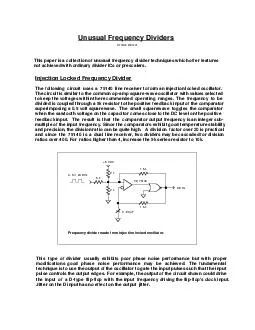
k k pF k k k V MHz MHz VDC The following circuit uses a line receiver to form an injection locked oscillator
by liane-varnes
5 k 15 k 0 80 pF 2 k 2 k 5 k 0 5 V 24 MHz 6 MHz ...
High-resolution dual-comb spectroscopy with
by pasty-toler
ultra-low . noise frequency combs. W. Hänsel. 1....
Inverter Disconnects During Transmission Disturbances
by debby-jeon
. James Merlo, Vice President, Reliability Risk ...
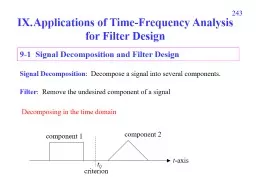
243 Applications of Time-Frequency Analysis
by alida-meadow
for Filter Design. 9-1 Signal Decomposition and ...
Today’s Lesson: What:
by jane-oiler
. analyzing graphs and histograms. Why: . ....
Data and Computer Communications
by conchita-marotz
Tenth . Edition. by William Stallings. Data and C...
Transparent Media Section 84
by eliza
1. Media often have bands of transparency coverin...
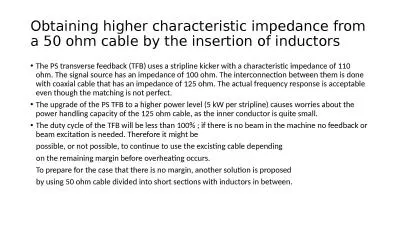
Obtaining higher characteristic impedance from a 50 ohm cable by the insertion of inductors
by alis
The PS transverse feedback (TFB) uses a stripline ...
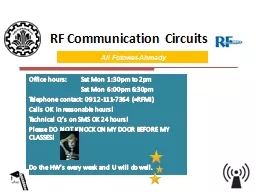
RF Communication Circuits
by ellena-manuel
Office hours: Sat . Mon 1:30pm to 2pm. . Sat...
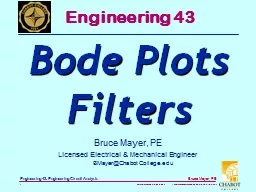
Bruce Mayer, PE
by luanne-stotts
Licensed Electrical & Mechanical Engineer. BM...
Broadband Mid-infrared
by tatyana-admore
Comb-Resolved . Fourier Transform Spectroscopy. K...
Squall lines, cloud microphysics and experiment 3
by giovanna-bartolotta
ATM 419. Spring 2016. Fovell. 1. Definition of . ...
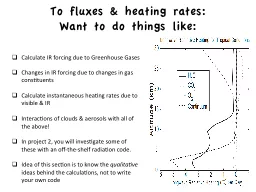
To fluxes & heating rates:
by pamella-moone
Want to do things like:. Calculate IR forcing due...
Cavity-enhanced spectroscopy of molecular hydrogen with abs
by phoebe-click
Daniel Lisak. Nicolaus Copernicus University, . I...
Wireless Connectivity
by yoshiko-marsland
LPRF Performance Line. :. Industry’s highest pe...
1 Review & Microstrip
by karlyn-bohler
Transmission Line, . Striplines. , Coaxial Cable...
Prociuction
by adah
of Nezo Radiations by Liy to study absorption ...
A histogram is a graphical representation of the distribution of data.
by zoe
It is an estimate of the probability distribution ...
Prof. David R. Jackson Dept. of ECE
by christina
Notes . 10. ECE 5317-6351 . Microwave Engineering....
Advances in
by trish-goza
doppler. broadening thermometry for the spectros...
Antenna Design Progress Chi-Chih Chen
by ellena-manuel
Research Associate Professor. Domenic . Belgiovan...
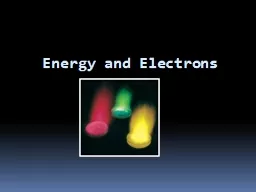
Energy and Electrons
by calandra-battersby
Wave-Particle Duality. JJ Thomson won the Nobel p...
Load More...